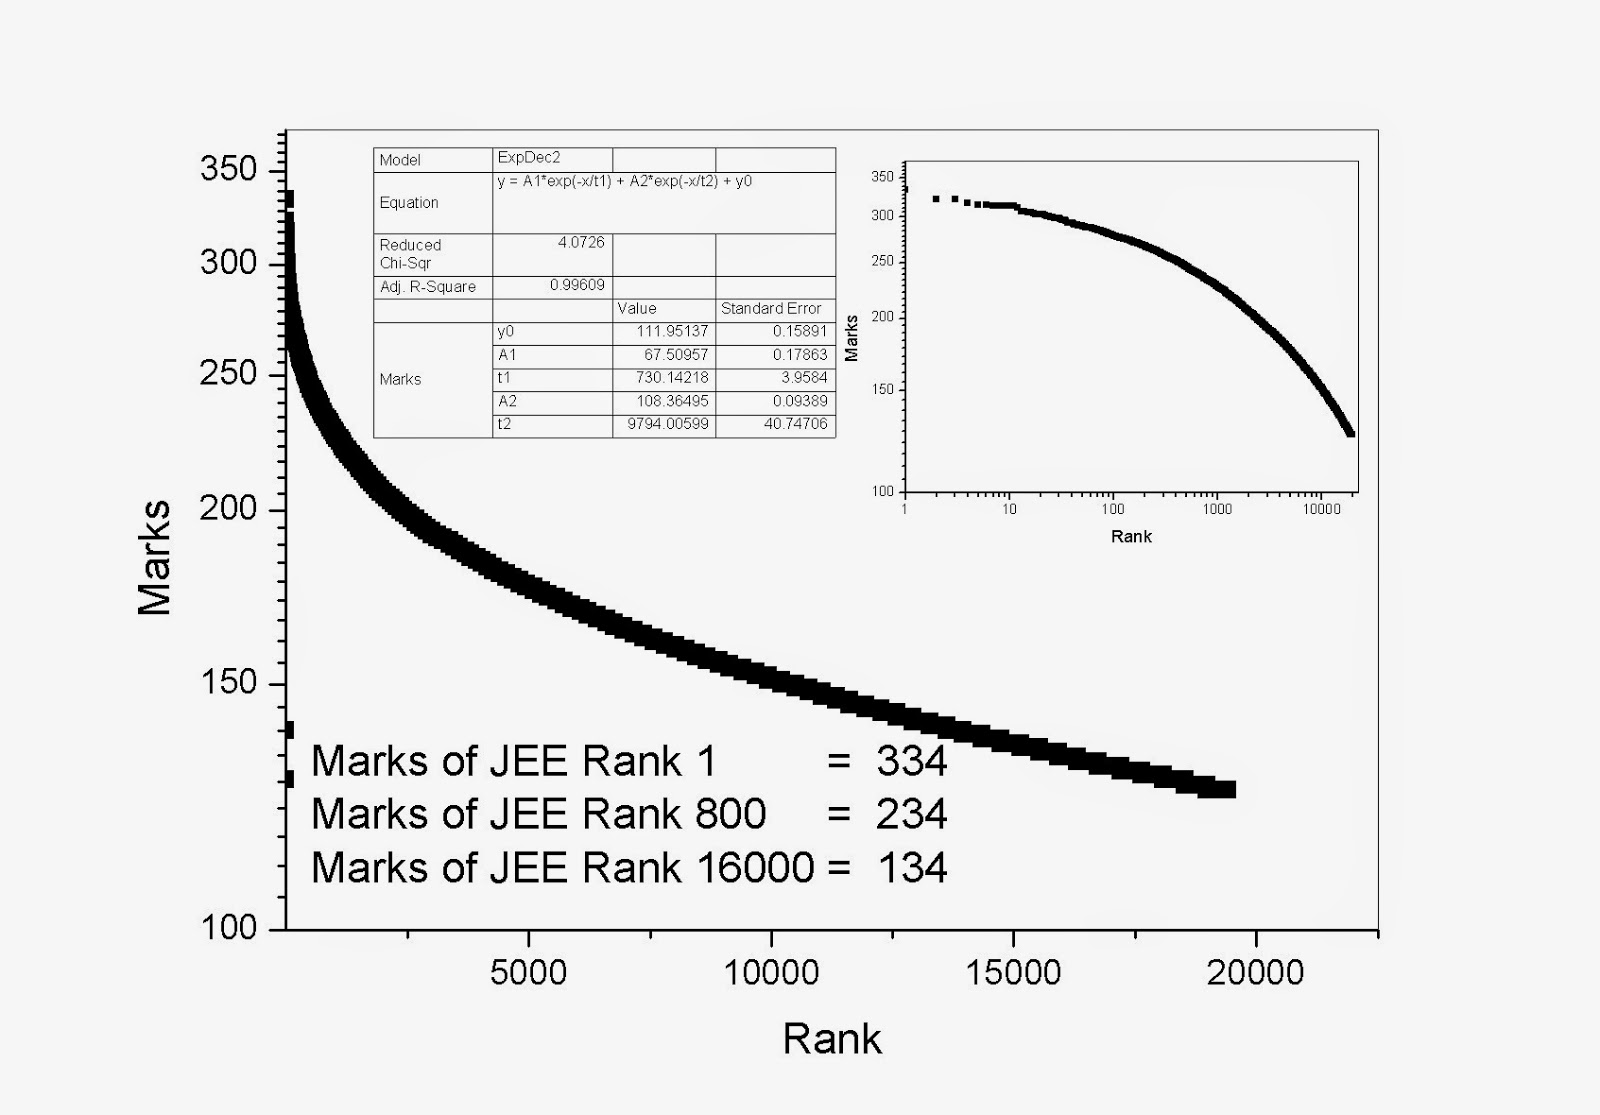
It would be interesting to see the graph with the (rank) x-axis on a log scale. Just to see how the variation is in the first few ranks.
Does this look any different from the distribution among the top 20000 from say 2010 ?
sir can u please give me your fb profile .... would like to add you ... i think the blog is great and truly inspiring!!!!
Hey ...its a bit wrong if you put x=1..you dont get y=334..
So, what are we going to get when increase the number of IITs and seats to 20,000 or who are we getting even at 5000 ?
Post a Comment

5 comments:
It would be interesting to see the graph with the (rank) x-axis on a log scale. Just to see how the variation is in the first few ranks.
Does this look any different from the distribution among the top 20000 from say 2010 ?
sir can u please give me your fb profile .... would like to add you ... i think the blog is great and truly inspiring!!!!
Hey ...its a bit wrong if you put x=1..you dont get y=334..
So, what are we going to get when increase the number of IITs and seats to 20,000 or who are we getting even at 5000 ?
Post a Comment